Visualising Hangfire job stats in Power BI
At my day job, we run everything in Azure, which means we make heavy use of Application Insights and Power BI for collecting and visualising stats about our servers and applications.
One of the not-Azure-specific parts we use is the excellent background job execution engine, Hangfire.
Hangfire ships with its own admin dashboard that’s great for showing you what Hangfire’s doing, but since that’s not Power BI, I don’t get the Hangfire job stats in the same unified view of all our other servers and app. Nor does the Hangfire dashboard give you any historical information.
I couldn’t figure an easy way to get the Hangfire stats into App Insights, so I set about making one.
Getting the Hangfire job stats into Power BI involved a couple of steps;
- Figure out how to call the Hangfire dashboard
/stats/endpoint to get the stats periodically. - Write an Azure Function that polls the same
/stats/endpoint and pushes the results into App Insights — I poll every minute, but faster would work too. - Consume the stats into Power BI and visualise nicely.
- ??
- $$ Profit!
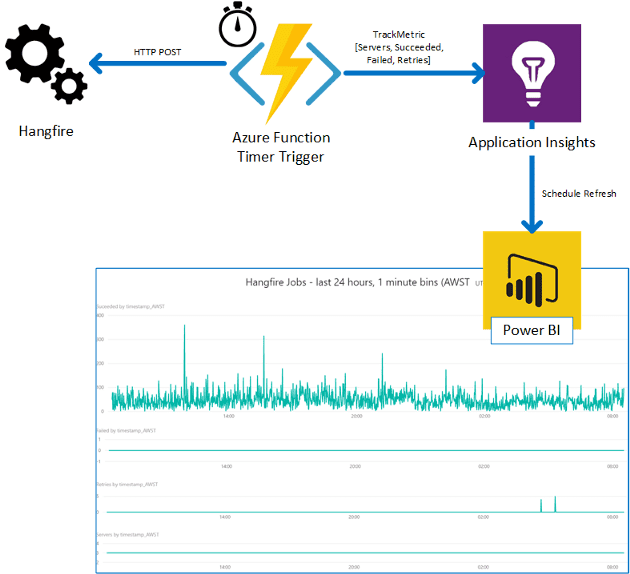 Dataflow for getting Hangfire stats into PowerBI
Step 1.
Looking at the network traffic in the browser, we can see that the browser calls /stats/ like so;
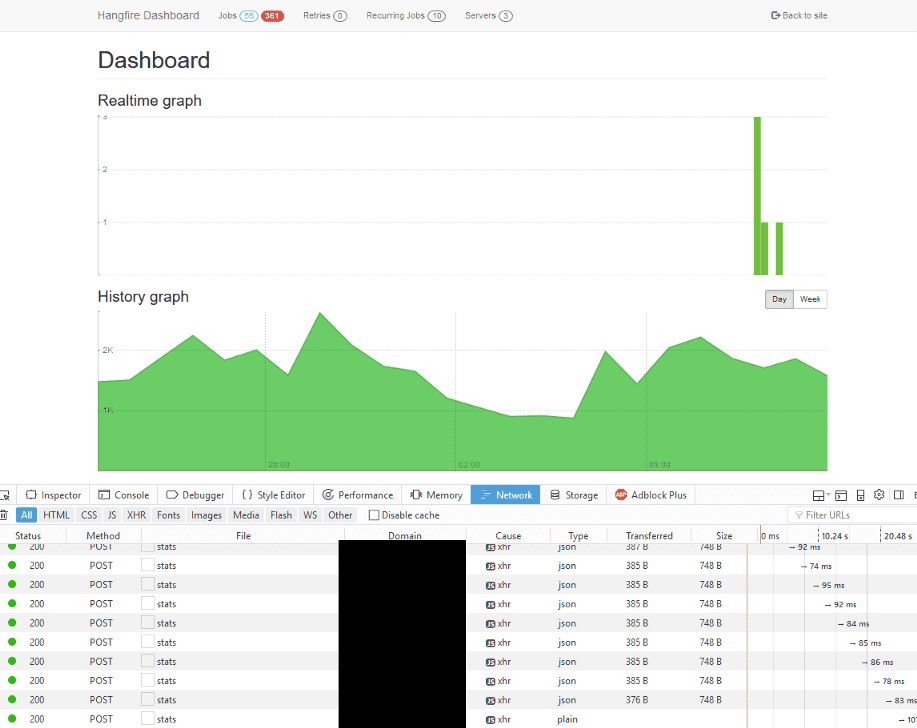
POST https://{hangfire_server}/hangfire/stats

Content-Type : application/x-www-form-urlencoded; charset=UTF-8
Body : metrics[]=enqueued:count-or-null&metrics[]=failed:count-or-null
&metrics[]=retries:count&metrics[]=recurring:count
&metrics[]=servers:count&metrics[]=succeeded:count&metrics[]=failed:count
&metrics[]=succeeded:count
We’ve customised our Hangfire dashboard with a custom IDashboardAuthorizationFilter that uses cookies with 24hr session expiry, so I also had to figure out how to authenticate in a stateless manner. Since step 2 involves an Azure Function — which is stateless by design — I didn’t want to have to mess around with cookies if I could avoid it.
Then use Postman (or your REST client of choice) to craft the simplest repeatable request that works for your situation.
Step 2.
Write a timer triggered Azure Function that POSTs to the /stats/ endpoint, parses the result, and sends the data to App Insights. (I tried out Flurl.Http http client with its fluent API… very impressed)
You can find the source on github, https://gist.github.com/tonesandtones/8f45ab89e90d4474b108a35898a0d636 (or the embed below)
I used the Microsoft.ApplicationInsights package, which makes it really easy to post metrics to App Insights, just
(new TelemetryClient).TrackMetric(“Metric Name”, metricValue)They then show up in App Insights as CustomMetrics.
I’m only interested in the Hangfire servers, succeeded, failed, and retry metrics, so they’re the only ones I publish into App Insights (apologies for the out-of-date-screenshot, I added the servers metric after I’d taken all the screenshots for this post)
Step 3.
Getting the data out of App Insights and into Power BI is a little awkward, but fairly easy. Once you’ve got your analytics query giving you the results you want, export it to an M-Query script, and import that script into Power BI as a Blank Query datasource. See https://docs.microsoft.com/en-us/azure/application-insights/app-insights-export-power-bi#export-analytics-queries
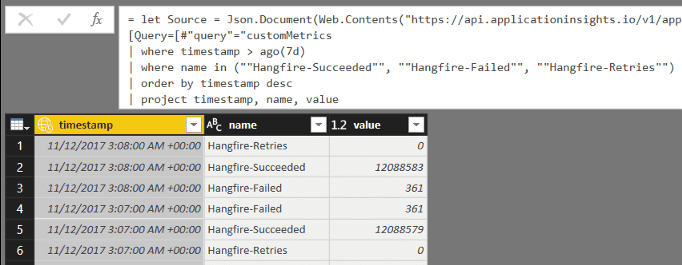
 AIQL for getting the stats out of App Insights
 Getting the MQuery text out of App Insights
 …and in to PowerBI
In my visualisation, I’m after a plot of the number of jobs that succeed and fail at each point in time (whatever my bin size ends up being). Unfortunately the Hangfire /stats/ endpoint only tells you the current total of succeeded and failed jobs each time you call it, so I have a couple of requirements for the data manipulation in Power BI;
- calculate the delta of failed/succeeded jobs between subsequent calls, and
- be able to get the total jobs that succeeded/failed in, say, 15 minute bins, or any bin size we choose.
Note that the Retries metric is only the number of jobs being retried at the instant the stats are gathered, so we don’t need the delta for that metric. It’s also not particularly accurate, but it’s enough to show up any persistent errors that need attention. Ditto for Servers, since that’s the count of servers Hangfire thinks are active at any given moment.
Since I get the results out of App Insights in a single query, I needed to do the following steps to get the data in the form I need;
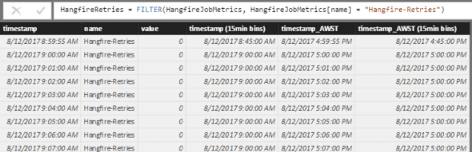
- Split the one table from App Insights into 3 tables, one for each metric name,
- For the succeeded and failed metrics, use this Power BI community post https://community.powerbi.com/t5/Desktop/Calculate-Difference-Between-Latest-Date-and-Previous-Date/m-p/179532 to calculate the delta between each row and the previous.)
- Add calculated rows to convert the UTC timestamps into my local timezone — because Power BI’s handling of timezones is pretty abysmal at the moment
- Finally, create groupings from the timestamps to produce 15 minute bins
(No doubt someone with better Power BI skills than mine could do a better job, but this approach works for my purposes)


| --2018-07-18 Updated to use new RANKX function to deal with duplicate timestamp values. | |
| -- | |
| --When there are duplicate timestamp values in the dataset, using the previous method (with EARLIER()) would create | |
| --index values that run, eg, 122, 123, 123, 125, 126. | |
| --Supposing therer were 100 new items per row, and ~5000 total (so total would run 4900, 5000, 5100, 5200, etc), | |
| --the ValueChange would run 100, 100, 5000(!!), 100, 100. | |
| --Now, using a RANKX() with Dense enumeration (https://msdn.microsoft.com/en-us/query-bi/dax/rankx-function-dax), | |
| --we can get dense indices that don't skip, so we can lookup Index-1 and know it always exists. | |
| ------------------------------------------ | |
| --must be DENSE rank so we can lookup value(rank+1) and not get missing values | |
| Index = RANKX(HangfireSuceeded, HangfireSuceeded[timestamp], HangfireSuceeded[timestamp], ASC, Dense) | |
| --Now with dense rank, HangfireSuceeded[Index]-1 is guaranteed to exist | |
| Value Change = | |
| IF ( | |
| HangfireSuceeded[Index] = 1, | |
| 0, | |
| HangfireSuceeded[value] - LOOKUPVALUE(HangfireSuceeded[value], HangfireSuceeded[Index], HangfireSuceeded[Index]-1) | |
| ) |
Once all that’s in place, drag and drop the 4 metrics onto 4 line graphs (pick the graph type of your choice — bar graphs would work too). With the 15 minute bins, I can choose from 1 minute (source) or 15 minute (binned) resolution. On the graphs with 1 minute resolution, I also added a filter to pick just the last 1440 minutes (24 hours) of data.
We use Power BI Pro, so it was then a simple matter of publishing the report to our Power BI instance, and setting up a refresh schedule to have Power BI refresh the data every hour.
The finished product
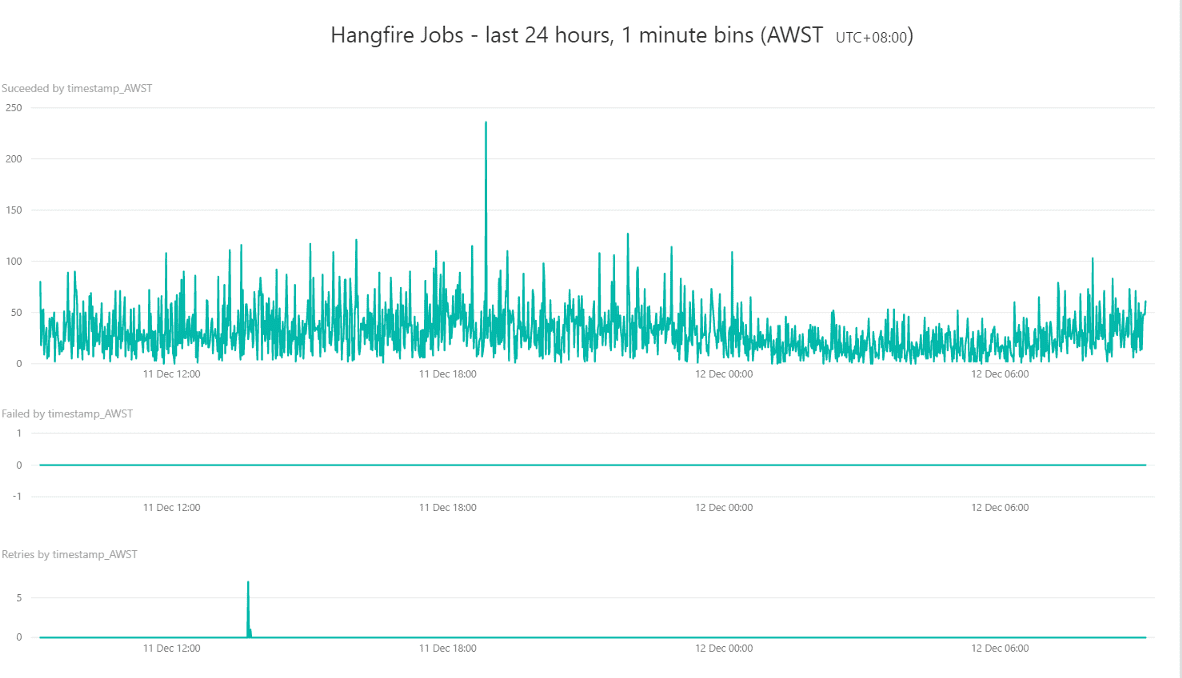 24 Hours of data at 1 minute resolution
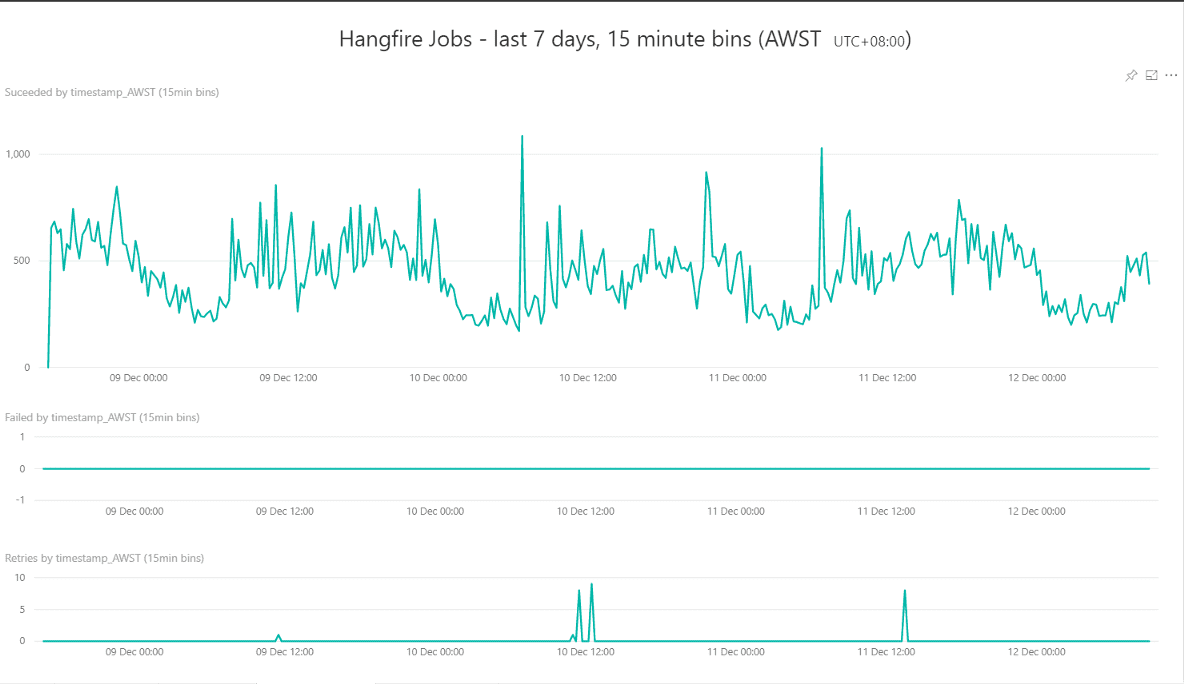 And 7 days of data at 15 minute resolution
(Again, sorry for the out of date screenshots, I added the servers metric as another line graph at the bottom after they were taken)
Source code
(https://gist.github.com/tonesandtones/8f45ab89e90d4474b108a35898a0d636)
(You don’t need to point out how gross this code is, this whole process is the product of a couple of hours on a Friday afternoon — it ain’t pretty , but it works ;-) )
| using System; | |
| using System.Collections.Generic; | |
| using System.Configuration; | |
| using System.Globalization; | |
| using System.Net.Http; | |
| using System.Text; | |
| using System.Threading.Tasks; | |
| using Microsoft.Azure.WebJobs; | |
| using Microsoft.Azure.WebJobs.Host; | |
| using Flurl.Http; | |
| using Microsoft.ApplicationInsights; | |
| using Microsoft.ApplicationInsights.Extensibility; | |
| using Newtonsoft.Json; | |
| namespace HangfireStatsCollector | |
| { | |
| public static class HangfireStatsCollector | |
| { | |
| private static readonly string key; | |
| private static readonly TelemetryClient telemetry; | |
| static HangfireStatsCollector() | |
| { | |
| key = ConfigurationManager.AppSettings["HangfireMetricsAppInsightsSinkKey"]; | |
| if (!string.IsNullOrEmpty(key)) | |
| { | |
| TelemetryConfiguration.Active.InstrumentationKey = key; | |
| telemetry = new TelemetryClient() { InstrumentationKey = key }; | |
| } | |
| } | |
| [FunctionName("HangfireStatsCollector")] | |
| public static async Task Run( | |
| [TimerTrigger("0 */1 * * * *", RunOnStartup = true)] TimerInfo myTimer, | |
| TraceWriter log) | |
| { | |
| log.Info($"C# Timer trigger function executed at: {DateTime.Now}"); | |
| if (telemetry == null) | |
| { | |
| log.Error("No App Insights instrumentation key available. Cannot publish metrics."); | |
| return; | |
| } | |
| IList<string> paramsToFetch = new List<string> | |
| { | |
| "enqueued:count-or-null", | |
| "retries:count", | |
| "recurring:count", | |
| "servers:count", | |
| "succeeded:count", | |
| "failed:count" | |
| }; | |
| string ps = "metrics[]=" + string.Join("&metrics[]=", paramsToFetch); | |
| string statsUrl = ConfigurationManager.AppSettings["HangfireStatsUrl"]; | |
| if (string.IsNullOrEmpty(statsUrl)) | |
| { | |
| log.Error("No Hangfire stats target URL specified. Cannot fetch metrics"); | |
| return; | |
| } | |
| HangfireStatsWrapper stats; | |
| try | |
| { | |
| stats = | |
| await statsUrl | |
| .PostAsync( | |
| new StringContent(ps, Encoding.UTF8, "application/x-www-form-urlencoded")) | |
| .ReceiveJson<HangfireStatsWrapper>(); | |
| } | |
| catch (Exception e) | |
| { | |
| log.Error("Unexpected exception", e); | |
| telemetry.TrackException(e); | |
| throw; | |
| } | |
| log.Info($"Got Hangfire stats: Succeeded = {stats.Succeeded.Value}, Retries = {stats.Retries.Value}, Failed = {stats.Failed.Value}"); | |
| if (stats.Retries.ValueInt.HasValue) telemetry.TrackMetric("Hangfire-Retries", stats.Retries.ValueInt.Value); | |
| if (stats.Succeeded.ValueInt.HasValue) telemetry.TrackMetric("Hangfire-Succeeded", stats.Succeeded.ValueInt.Value); | |
| if (stats.Failed.ValueInt.HasValue) telemetry.TrackMetric("Hangfire-Failed", stats.Failed.ValueInt.Value); | |
| if (stats.Servers.ValueInt.HasValue) telemetry.TrackMetric("Hangfire-Servers", stats.Servers.ValueInt.Value); | |
| telemetry.Flush(); | |
| } | |
| } | |
| public class HangfireStatsWrapper | |
| { | |
| [JsonProperty("enqueued:count-or-null")] | |
| public HangfireStat Enqueued { get; set; } | |
| [JsonProperty("retries:count")] | |
| public HangfireStat Retries { get; set; } | |
| [JsonProperty("recurring:count")] | |
| public HangfireStat Recurring { get; set; } | |
| [JsonProperty("servers:count")] | |
| public HangfireStat Servers { get; set; } | |
| [JsonProperty("succeeded:count")] | |
| public HangfireStat Succeeded { get; set; } | |
| [JsonProperty("failed:count")] | |
| public HangfireStat Failed { get; set; } | |
| } | |
| public class HangfireStat | |
| { | |
| public string Value { get; set; } | |
| [JsonIgnore] | |
| public int? ValueInt | |
| { | |
| get | |
| { | |
| if (int.TryParse(Value, NumberStyles.AllowThousands, CultureInfo.InvariantCulture, out var valueResult)) | |
| { | |
| return valueResult; | |
| } | |
| else | |
| { | |
| return null; | |
| } | |
| } | |
| } | |
| } | |
| } |